How does geographic isolation shape genomic divergence, ecological
interactions, and phenotypic evolution? I integrate fieldwork, natural
history collections, genomics, AI, and open-source software to find
out.
Other projects
Systematics, Island Speciation, & Host-Parasite Interactions
Islands and mountains as natural laboratories of evolution
The Indo-Australian Archipelago (IAA) combines marine barriers, ancient
paleo-islands, and steep mountains, a system where isolation has
repeatedly driven diversification. During the Pleistocene, when sea levels
were lower, Sumatra, Java, and Borneo joined mainland Asia as Sundaland,
while Sulawesi, the Moluccas, and the Lesser Sundas stayed isolated by
deep water. Like the Sunda Shelf, the Sahul Shelf was continuous landmass
that connected the Australian continent to New Guinea during this time.
Within islands, mountains act as sky islands. Many of these regions remain
poorly surveyed. This exceptional geographic complexity provides a natural
laboratory for disentangling how different forms and histories of
isolation generate and maintain biodiversity. I ask how geographic
isolation shapes genomic divergence, ecological interactions, and
phenotypic evolution.
Pleistocene low sea-level boundaries
Sea level: today
Swipe to explore →
As Pleistocene ice sheets grew, sea level fell by up to ~120 m, most
recently at the Last Glacial Maximum about 20,000 years ago. The shallow
Sunda Shelf joined Sumatra, Java, and Borneo to Asia as
Sundaland,
and the Sahul Shelf joined New Guinea to Australia, while Sulawesi and
the rest of Wallacea
stayed surrounded by deep water. Exposed shelves from ETOPO1 bathymetry;
line placements are approximate.
In situ diversification of the Bunomys clade on Sulawesi
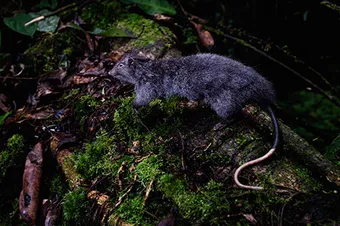
My main study system is the most speciose rodent clade on Sulawesi: the Bunomys clade. I study its systematics and in situ diversification. Integrating morphology,
multi-marker Sanger sequencing, and ultra-conserved elements, we revealed taxonomic
problems in the group and a complex interplay between paleo-islands, tectonic
plates, and mountain formation in promoting its diversification, with mixed
support for the Area of Endemism paradigm on Sulawesi.
This work builds on 13 years of collaborative field expeditions across
more than 20 remote mountain systems in Southeast Asia: over 20
field-collecting expeditions contributing more than 8,000 voucher
specimens and 30,000 specimen parts to natural history collections.
Together with collaborators, this fieldwork has contributed to the
description or revision of more than 24 mammal species. Beyond
Bunomys, I support collaborative studies of shrew diversification
on Sulawesi, Java, and Sumatra. I received the 2023 Murie Family
Conservation Award from the American Society of Mammalogists for the
significance of this work in conserving mammals and their habitats.
Systematic and Divergence times of the Bunomys clade
Bunomys
Taeromys
Frateromys, Lenomys, Eropeplus, gen. nov.
Halmaheramys (Halmahera)
Time-calibrated tree of 19 species from 55 individuals
and five loci, estimated with BEAST 2. Halmaheramys of the northern Moluccas is sister to all Sulawesi lineages,
with the divergence date estimated at
2.81 Ma (95% HPD 2.34–3.25), near the
start of the Pleistocene. Bars span the 95% HPD of each node age; filled
nodes have posterior probability ≥ 0.95. Outgroups are pruned. Learn more in Handika et al., 2021.
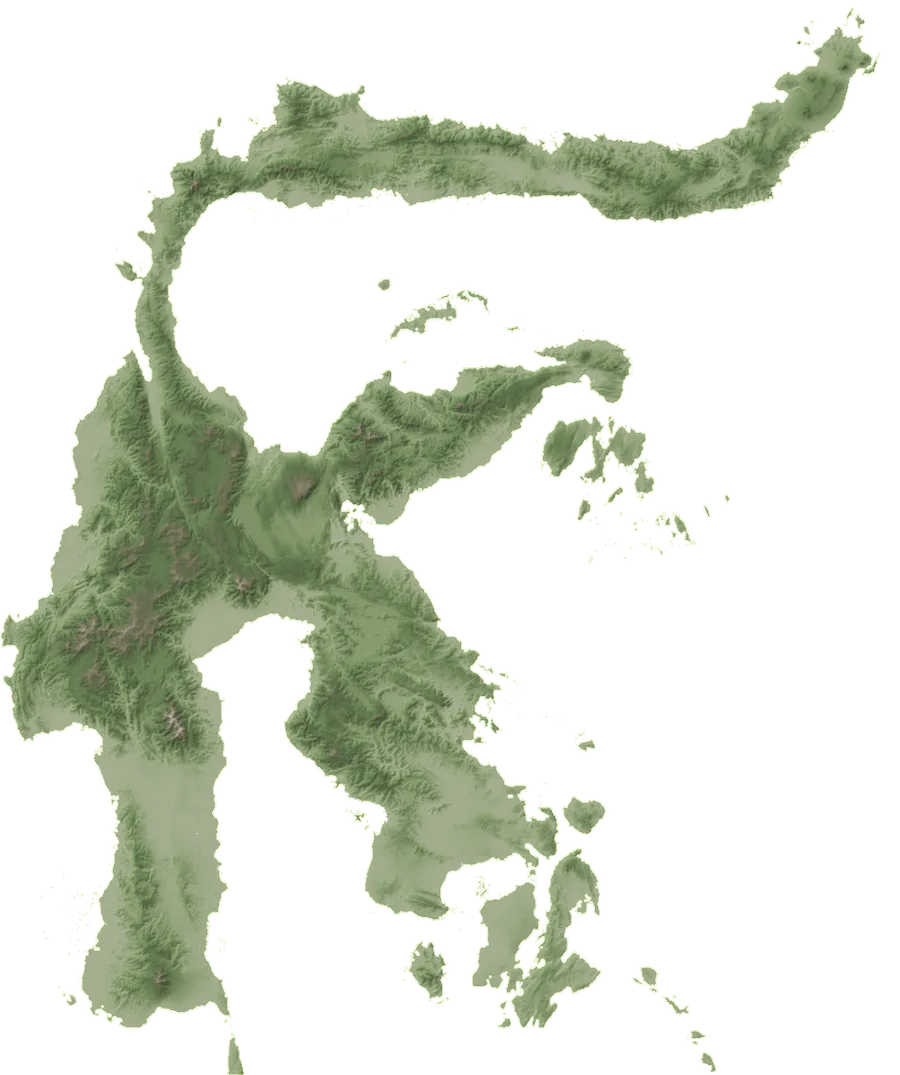
Sulawesi as an island of islands: A brief overview
Sulawesi is a complex island with a rich geological history. It has been
shaped by ancient paleo-islands, tectonic plate movements, and mountain
formation. Together, these factors have shaped the Bunomys radiation.
Above about 1,000 m, many species are confined to a single mountain, while others
have widespread distributions that span multiple mountains and across the island.
Four sky islands in the central core
Swipe to explore →
Select a taxon to see where it lives
Montane
Widespread
Orange dots are Taeromys dominator, the only taxon on all four
mountains. Select a taxon to show its populations and elevation range.
Distance alone does not predict shared ancestry. Rorekatimbo and
Torompupu,
43 km apart, have different E. canus haplogroups yet
share B. penitus WC-B. Mts. Gandangdewata and Latimojong,
99 km apart, on the other hand, share an E. canus haplogroup but not
B. torajae. The peaks in the schematic profile are drawn according
to their present-day summit heights.
Across the island
Sulawesi is often divided into seven areas of endemism (AoEs) separated by
narrow boundary zones. Taeromys dominator, a large endemic rat
found across the island and from lowlands to high elevations, shows how
messy the system is: one ancestry cluster spans mountains in every area of
endemism, populations in the southeast carry a distinct cluster, and
several individuals are admixed, so the AoE boundaries are only partly
respected.
Cluster 2 occurs in every area of endemism sampled, from the southwest peninsula
to the northeastern tip.
Cluster 4 dominates the southeast (Lawaki), with a trace in one west-central individual.
Cluster 1 and
Cluster 3 occur at scattered sites, and several individuals are admixed, some sharing
a mountain with unadmixed neighbours.
Each bar is one individual
Hover or tap a bar or pie, or tab to a pie, to see the specimen,
locality, and ancestry.
Choosing K
DLK2
PopCluster's DLK2 statistic, the second-order change in likelihood
between successive K, peaks at K = 4 (K = 1–7, five replicates each).
Ancestry of 29 T. dominator from 12 localities, estimated from ultra-conserved
element (UCE) SNPs with PopCluster at K = 4, the best-supported K by DLK2. Each
pie is one individual; individuals from the same locality are fanned out around
it. The bands mark the boundary zones between areas of endemism.
Parasites and microbiomes: collaborations and next steps
The evolutionary history of the Bunomys clade also provides a framework
for asking whether parasites co-evolve with their hosts or cross species boundaries.
Work led by Kevin Rowe's lab at Museums Victoria, Australia, on which I am a co-author, documented native and introduced Trypanosoma lineages in Sulawesi rodents, with high prevalence in several Bunomys
species and infections from village edges to remote montane forests, peaking
above 2,000 m. The Esselstyn lab studies the gut microbial communities of Sulawesi shrews and rodents.
Building on these collaborations, parasite evolution is a direction I hope
to pursue by integrating host population genomics, parasite phylogenies,
environmental data, and single-cell sequencing. This framework would test
whether parasite diversification parallels host history or reflects host
switching and local adaptation, while also examining how these processes
shape host-cell tropism and immune responses. Single-cell or
single-nucleus sequencing of infected tissues could link host and parasite
genetic variation to the specific cell types and transcriptional states
associated with infection. To lay the groundwork, NAHPU records parasites collected in the field alongside their host specimens and
tracks their screening, keeping parasite identity, infection status, and molecular
data linked to the host from which they originated.
Sampling and data
1Field collection
Collect host specimens and associated parasites with environmental
metadata (location, habitat, climate).
2Sample processing
Host tissue for genomics and single-cell, parasites for genomics and
transcriptomics, and host and parasite IDs.
3Data generation
Host population genomics Whole genome or targeted sequencing
Parasite genomics Phylogenies and population structure
Single-cell or single-nucleus RNA-seq Host and parasite transcripts in infected tissues
Environmental data Climate, land use, and altitude
4Linked in
NAHPU
Links each parasite to its host specimen and collection metadata
Tracks screening results, sequencing data, and tissue use
Maintains the chain from field specimen → molecular data → analyses
Analyses
A. Host population genomics
Host genetic structure and history
Population 1
Population 2
Population 3
B. Parasite phylogenetics
Parasite evolutionary relationships and host associations
Tips colored by host population
C. Single-cell transcriptomics
Host and parasite cells, cell types, and infection states
Host immune
Host epithelial
Other host
Parasite
Infected host
D. Environmental context
Environmental drivers of host and parasite variation
Population 1
Population 2
Population 3
Key questions
1 Do parasite lineages preferentially occupy particular host cell types?
2 Do parasite lineages elicit different cellular responses in different host populations or species?
3 Do recently host-switched parasites show different cell-type tropism or transcriptional states from long-associated parasites?
Outcomes
Test whether parasite diversification parallels host history or reflects host switching and local adaptation.
Identify host cell types and immune pathways targeted by different parasite lineages.
Link evolutionary patterns to environmental drivers and cellular mechanisms of infection.
Proposed study design. Field samples linked in NAHPU support four analyses
that together address host–parasite evolution from populations to cells.
Speciation and systematics:
Handika et. al. (
An island of islands: complex gene tree discordance and local endemism on a recent, rapid rodent radiation on Sulawesi
Handika, H., Rowe, K.C., Achmadi, A.S., Zulkurnia Irsaf, Swanson, M. T., and Esselstyn, J.A. In prep
,
A new species of Frateromys from the Northern Peninsula of Sulawesi, Indonesia
Handika, H., Rowe, K.C., Achmadi, A.S., Swanson, M. T., and Esselstyn, J.A. In prep
,
Molecular and morphological systematics of the Bunomys division (Rodentia: Muridae), an endemic radiation on Sulawesi
Handika, H., Achmadi, A.S., Esselstyn, J.A., and Rowe, K.C. 2021
Systematics and historical biogeography of Crunomys and Maxomys (Muridae: Murinae), with the description of a new species from Sulawesi and new genus-level classification
Giarla, T. C., Achmadi, A.S., Fabre, P. H., Handika, H., Chipps, A. S., Swanson, M.T., Nations, J. A., Morni, M. A., William-Dee, J., Inayah, N., Jayanti, E. D., Nurdin, M.R.T.J., Griffin, K. E., Khan, F. A. A., Heaney, L. R., Rowe, K. C., Esselstyn, J. A. 2025
Trypanosoma (Euglenozoa: Kinetoplastea) infections in rodents, bats, and shrews along an elevation and disturbance gradient in Central Sulawesi, Indonesia
Mursyid, A., Achmadi, A.S., Novarino, W., Handika, H., Nugroho, H.A., Anita, S., Adams, A.L., Rowe, K.M.C., and Rowe, K.C. 2023
AI-assisted phenomics: quantifying complex traits at scale
Coloration is a complex, multidimensional phenotype that is difficult to
compare consistently across large numbers of samples. Its variation can
reflect shared ancestry, convergence, and environmental selection. Image
embeddings provide a scalable way to quantify this variation: a vision model
converts each specimen photograph into a numerical representation. These
embeddings place visually similar specimens near one another in trait space.
This makes appearance measurable across hundreds of thousands of digitized
specimens. I use these embeddings to identify visually similar species, map
the morphospace of butterfly wing patterns, and test whether phenotypic
similarity recovers known mimicry relationships. Combined with language
models for natural-language search, this work shows how I use emerging AI
tools to extract evolutionary information from natural history collections.
Each specimen image becomes a vector. Distances between vectors measure
phenotypic similarity, so color patterns can be compared across hundreds of
thousands of specimens and tested against genomes and geography.
The butterfly morphospace: upper and under wings tell different stories
Each point is a species centroid in a principal-component space of image
embeddings of digitized butterfly specimens. Switch between the dorsal and
ventral surfaces to see the shift in morphospace. Some families, such as the
skippers (Hesperiidae) and whites and sulphurs (Pieridae) separate clearly,
while many lineages change position between sides. Hover a point for its
name, or pick a family to highlight it.
Loading…● dorsal ○ ventral
species in the morphospace
6,424
species in the morphospace
seen from both wing sides
3,764
seen from both wing sides
genera with integrated dorsal and ventral patterns (Mantel p < 0.05)
131/192
genera with integrated dorsal and ventral patterns (Mantel p < 0.05)
dorso-ventral integration across all species
r = 0.71
dorso-ventral integration across all species
Does visual similarity recover butterfly mimicry?
Mimicry is a direct test of whether image embeddings capture what predators
perceive. I compiled published Müllerian and Batesian butterfly mimicry
pairs and, using dorsal wings, ranked how similar each partner is to the
other among all species in the collection. Mimicry pairs rank far above
chance, and above congeners. The misses are informative: in Papilio polytes and P. glaucus only some females mimic, and Heliconius timareta varies across its range. More work is needed to account for these variations.
However, this initial work shows the potential of image embeddings to capture
biologically meaningful visual similarity, and that this similarity can be used
to study mimicry, species interactions, and phenotypic evolution. Use the interactive
plots below to explore the results.
● first species queries · ○ second species queries mutual top 10
1101001k10kPartner rank among all species (log) →
Dorsal rank of each mimicry pair among 8,409 species when either member queries the collection (1 = most similar; dashed green = the top 10 shown on species pages, dotted = chance). In 6 of 11 pairs, both partners place each other in their top 10 on the dorsal side (highlighted). Hover a dot for its rank, or open a pair for its ranks, notes, and references.
pairs mutually in the top 10 of 8,409 species on the dorsal side
6/11
pairs mutually in the top 10 of 8,409 species on the dorsal side
mean dorsal partner percentile (chance = 0.50)
0.997
mean dorsal partner percentile (chance = 0.50)
against random and congener nulls (10,000 permutations)
p ≤ 0.0001
against random and congener nulls (10,000 permutations)
Choosing an open-weight LLM for natural-language search
I designed natural-language search for a large specimen collection. The
system uses a language model to parse a question such as “orange butterflies
with black stripes from Peru” into structured search calls (color, country,
trait, or similarity). To choose the best model for production, I benchmark
open-weight models on the same set of queries, comparing accuracy,
consistency, latency, and token cost. Open-weight models keep the search
reproducible and let any institution with limited resources, run it on its
own server. It protects sensitive data, and allows for fine-tuning on
domain-specific text. See the interactive plot below to explore the results
of the benchmark.
in production evaluated
Share of correct tool calls over 18 query types × 5 repeats per model. gemma-4-31b-it answered all 90 correctly and stayed consistent on 16 of 18 query types.
Putting it all together: BioCosmos
BioCosmos brings this work together
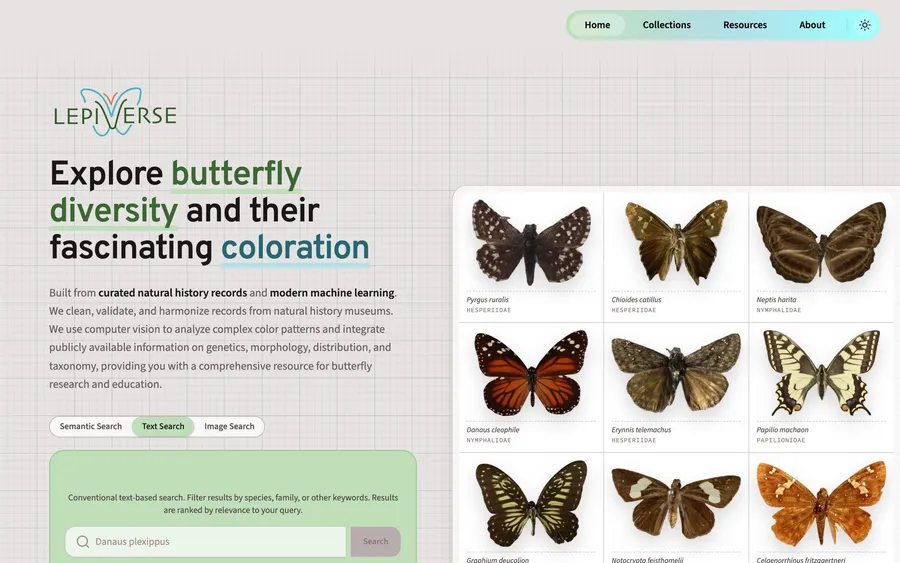
in a low-cost web platform, deployed through LepiVerse.com, for more than 600,000 digitized Lepidoptera specimen images. Image
embeddings power visual-similarity search and interactive morphospace plots,
an open-weight language model turns plain-language questions into searches,
and taxonomic harmonization and geographic validation keep the underlying
data clean. The result shows that emerging AI tools can make large natural
history collections explorable for anyone with a browser. To see how the
system is designed, explore the BioCosmos architecture in the Software section.
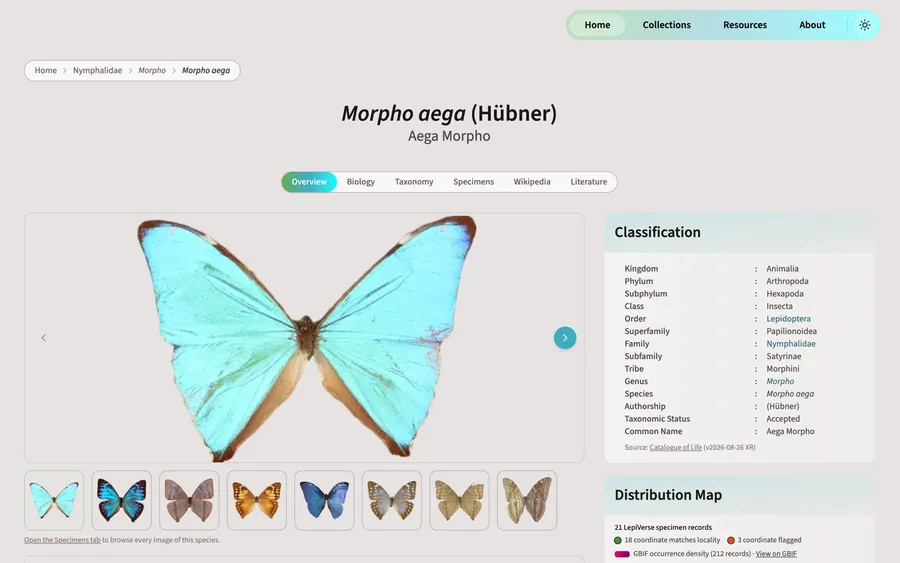
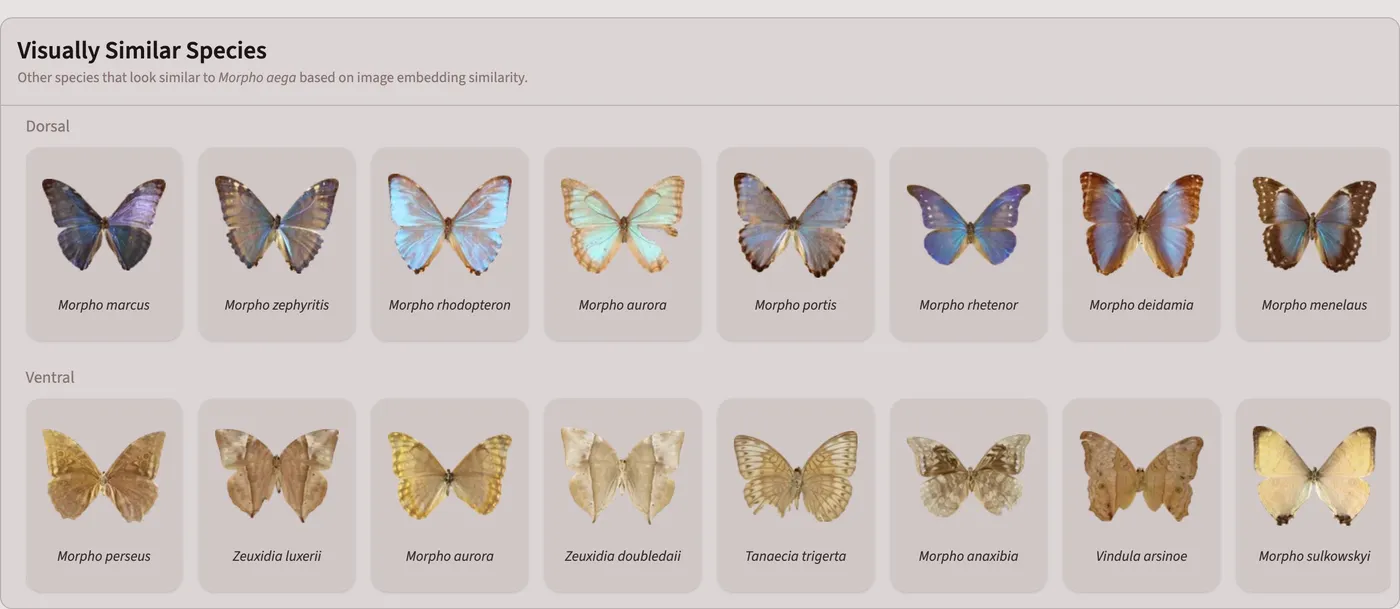
Visually similar species. Nearest neighbours
of Morpho aega in embedding space. Dorsal matches are all blue
Morpho, but the cryptic brown undersides also match Zeuxidia,
Tanaecia, and Vindula, from different genera.
Future directions
I hope to extend this framework to Indo-Australian rodents, asking whether
phenotypic divergence among isolated island and mountain populations
parallels genomic divergence or reflects local environments, and, through
collaborations, to frogs, reptiles, and birds.
Publications:
Handika et al. (
BioCosmos: computer vision and large-language models for large-scale image-based biodiversity exploration and trait discovery
Handika, H., Lürig, M. D., Nichtawitz, K. L., Dobon, O. M., Yarava, V. S., Shi, B. D., Elliott, M. J., Fortes, J. A. B., Porto, A. In prep
Digital Infrastructure for Accessible and Data-Rich Biodiversity Research
My 13 years of experience working in the complex island systems of
Southeast Asia exposed the limitations of conventional biodiversity
research workflows. These include difficulties in preserving the breadth
of information needed to understand complex biological systems,
integrating genomic and other diverse data types, providing real-time
feedback to reduce observer bias in the field, and enabling contributions
from researchers with limited computational resources. These challenges
motivate my software development efforts.
I develop free, open-source software spanning field data collection (NAHPU), phylogenomics (ULLAR), genomic data processing (SEGUL), taxonomy (Mammal Diversity Database), and AI-enabled specimen exploration and trait analyses (BioCosmos). Across my public repositories, I have added 1.3M lines of code and removed 623K.
These projects aim to make biodiversity research more efficient, reproducible, and
accessible, particularly to underfunded laboratories, while enabling new
research directions, such as using vector embedding approaches to study
multi-dimensional trait variation.
Software that runs anywhere and captures more
My tools work on anything, from a phone to a high-performance computing
cluster. It installs like everyday software, either with one click from
the app stores or a single command in the terminal, without requiring
additional applications, such as Docker or Singularity. Beyond speed, they
capture information that was difficult to record before. NAHPU, for
example, links every specimen part, field observation (e.g., habitat and
environmental conditions), parasite collection, and derivative data (e.g.,
audio, video, and photographs) to its voucher from the moment of
collection. It generates statistics that detects outlier measurements and
aids decision-making in the field. This includes prioritizing specimens
for complete tissue sampling when preservation resources are limited and
reducing observer bias toward specimens that are easier or more convenient
to collect.
Cross-platform Software Design Approaches: NAHPU as an example
NAHPU is a field cataloging app for
collection-based research, from specimens to the parasites collected from them
and their screening status. It has to work on a phone or a tablet at a remote
field camp and on a laptop back at the museum, with or without internet. I build
it in layers: a Flutter interface on top, application state and domain workflows
in the middle, a SQLite database for records, and performance-critical, reusable
code in Rust crates interfaced through a generated bridge. Each layer has one
job, which keeps the app fast, testable, and easy for new contributors to learn.
The full design is documented in the NAHPU developer docs.
Hover, tap, or tab to a layer to see what it does. Screens stay thin, workflows live in services, and heavy lifting goes to Rust.
01
Offline first
Field stations rarely have internet. Everything runs and stores locally, and the data is easy to share with others without an internet connection.
02
Thin screens
UI only renders state. Workflows live in providers and services, so they are testable and reusable.
03
One source of truth
A SQLite database stores the data, while versioned configs capture reproducible settings, keeping data and configuration separate for easier sharing, reproduction, and curation.
04
Rust for performance
Archives, Darwin Core export, PDFs, and GIS run in small reusable Rust crates behind a thin bridge.
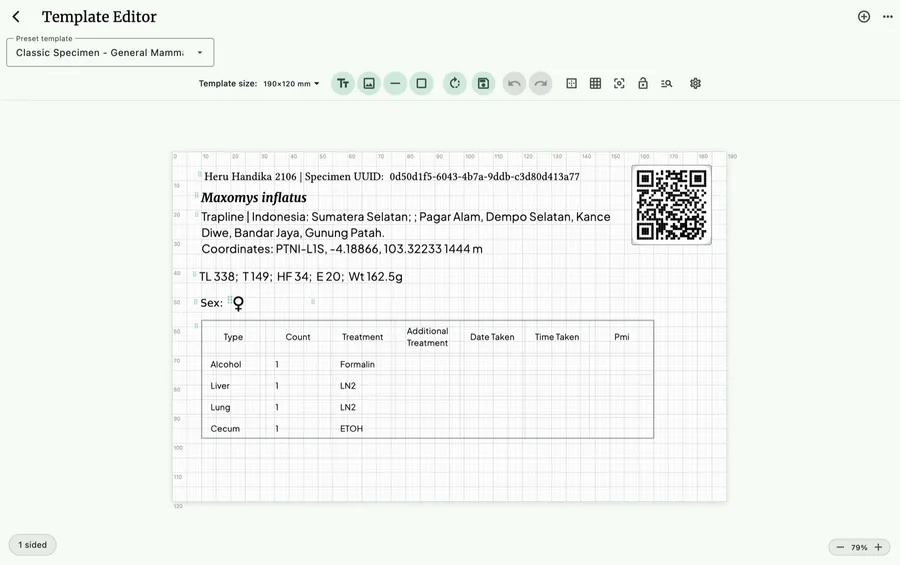
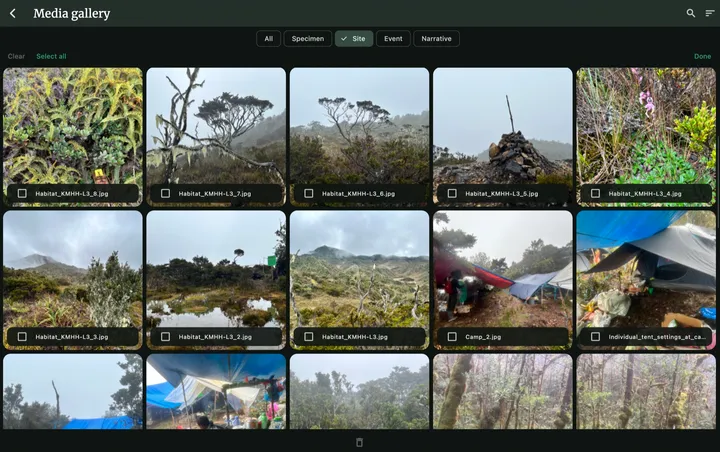
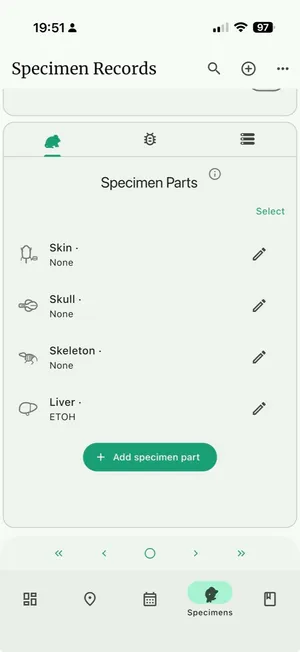
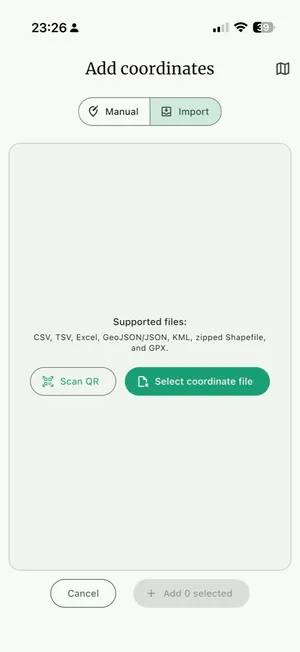
Label template editormacOS
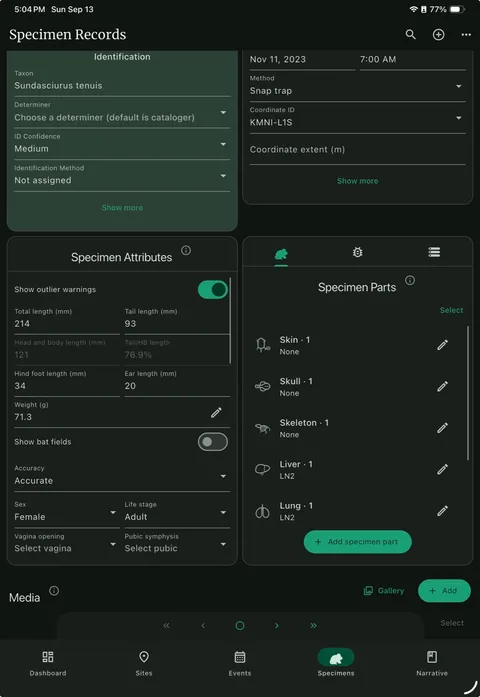
Specimen recordiPad
Media gallerymacOS
ProjectsiPhone
Specimen partsiPhone
Coordinate importiPhone
BioCosmos: A lightweight web architecture for AI-enabled search and trait exploration
BioCosmos,
the platform behind LepiVerse,
lets anyone search more than 600,000 butterfly specimen images by name,
image, or a plain-language question. Its design problem is that it must
answer open-ended questions over hundreds of thousands of images and their
embeddings on a single, modest server. I built it as one FastAPI process that holds everything needed for the search. An open-weight language
model plans the search, the CLIP and UNICOM vision
models encode it, and two embedded databases execute it. DuckDB, an in-process analytical (OLAP) database is for metadata, taxonomy,
localities, and traits, and LanceDB, an in-process vector database is for the image embeddings. Neither
needs a database server, making the system lightweight and efficient. Both
query columnar files in place and exchange results as Arrow tables through Polars.
The language model never touches the data. It reads a question once and
returns typed tool calls for location, traits, common name, color, or
visual similarity. This design keep token usage low and data stay private.
Code then runs them in two stages: filters run concurrently as SQL in
DuckDB and intersect into an allowlist of species, and ranking tools
search the vector index only within that allowlist. Hard constraints stay
exact, and vector search spends its time only on candidates that can
match. Use the interactive diagram below to explore the architecture.
1 The planner reads Georgia as the US state, not the country (GE), and passes an ISO code plus a state.
2 With no ranking tool, the search is a pure filter.
3 DuckDB matches the state against the locality table derived from GBIF occurrences.
4 No vector search and no GPU: the answer comes straight from SQL.
Hover, tap, or tab to a component
to see what it does. The language model only plans; SQL filters and vector
search do the work, inside one process.
01
Embedded databases
DuckDB and LanceDB run in-process with the API, eliminating the need for a separate database server.
02
LLM planner with typed tools
The LLM only selects typed tools; arguments are validated, column names are defined in code, and values are bound rather than generated by the model, avoiding hallucinations and keeping data private.
03
Constraints before ranking
Exact SQL constraints narrow the candidate set before vector ranking, ensuring that similarity matches never violate a constraint.
Data preparation is handled by command-line packages that are decoupled
from the backend and can run independently. This design enables the code
to be used outside Biocosmos. The packages share the same uv workspace, ensuring consistent dependency management and versioning across
the project. They match taxonomic names against the Catalogue of Life, validate coordinates against GADM, and precompute visual similarity and morphospace tables. Each run
writes a manifest containing the SHA-256 hash of every generated output,
providing a verifiable record for traceability and reproducibility. The
same workspace also benchmarks candidate planner models, which informed
the selection of the open-weight model used in production (see the AI section).
SEGUL: Fast Phylogenomic Data Exploration Across Platforms
Between assembling loci and inferring trees lies an often overlooked step:
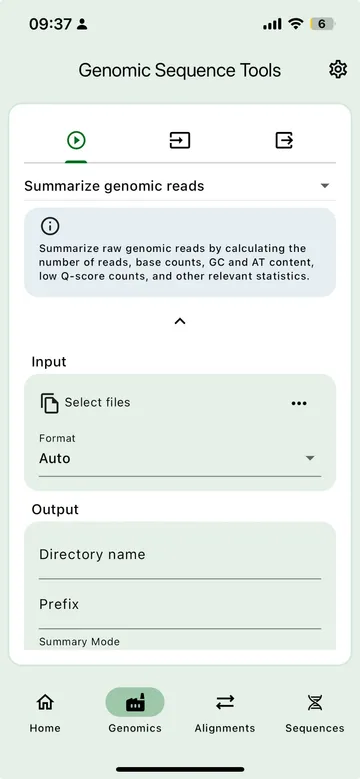
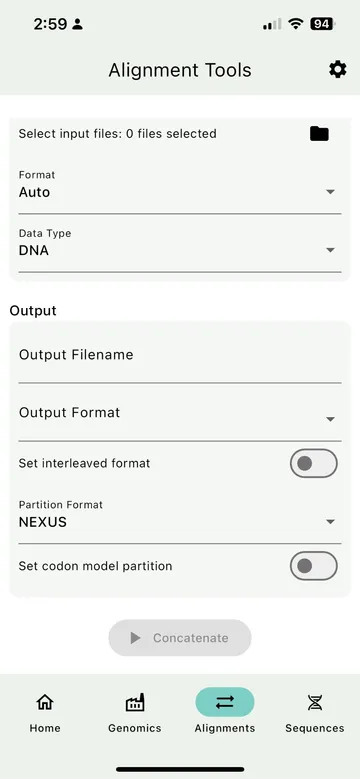
exploring the data. SEGUL
summarizes alignments, including taxon occupancy, missing data, and parsimony-informative
sites, as well as raw read and contigs. It also filters, concatenates, splits,
converts, and renames thousands of files in a single workflow. Its ability to
filter alignments by length, completeness, and informative sites is unique among
comparable tools. In an accompanying perspective, Chan (2024) described SEGUL as a proof of concept that efficient software can make genomic-scale
analyses more tractable and phylogenomics accessible to a broader range of users.
SEGUL received the 2024 Ernst Mayr Award from the Society of Systematic Biologists. I am now extending SEGUL and
ULLAR with automated
detection of outlier alignments and clearer diagnostics.
Command line
Single executable with no dependencies, work well in desktop and HPC environments.
conda install -c bioconda segul
Desktop & mobile app
Point and click on Windows, macOS, Linux, iOS, iPadOS, and Android.
Call SEGUL from scripts and notebooks through native bindings. No Rust knowledge required.
pip install pysegul
Rust
The core library behind every interface, and for building new tools.
cargo add segul
Every interface runs on the same high-performance Rust core, so users can
choose whichever platform best fits their workflow without sacrificing
performance. I benchmarked SEGUL against widely used alternatives (AMAS, goalign,
and Phyluce) using six published datasets spanning 239.3–522.5 million bases. Each benchmark was repeated 5 times on a desktop (AMD Ryzen 9 5900X, openSUSE Linux), an iPad, and an Android device (Handika & Esselstyn 2024). The interactive plot below lets you explore the results across tools,
datasets, and platforms.
The GUI calls the same Rust core as the command line. On the same Linux desktop it took 1.0–1.4× the command-line time across the five tasks. The iPad and Android runs are slower because of the hardware, yet still finish 522.5 Mb of alignments in seconds.
median GUI runtime relative to the command line on the same desktop (at most 1.4×)
1.3×
median GUI runtime relative to the command line on the same desktop (at most 1.4×)
tasks where the desktop GUI finished faster than the AMAS command line
8 of 10
tasks where the desktop GUI finished faster than the AMAS command line
median speedup over AMAS across 90 task, format, and dataset runs
4.5×
median speedup over AMAS across 90 task, format, and dataset runs
to summarize 522.5 Mb of alignments on an Android device, vs 92 s for AMAS on a desktop
14.2 s
to summarize 522.5 Mb of alignments on an Android device, vs 92 s for AMAS on a desktop
On the same machine, the GUI finishes within about a second of the
command line and still outpaces most command-line alternatives. The
slower execution on mobile devices is due to slower hardware compared to
a desktop.
Mammal Diversity Database: website, app, and tooling
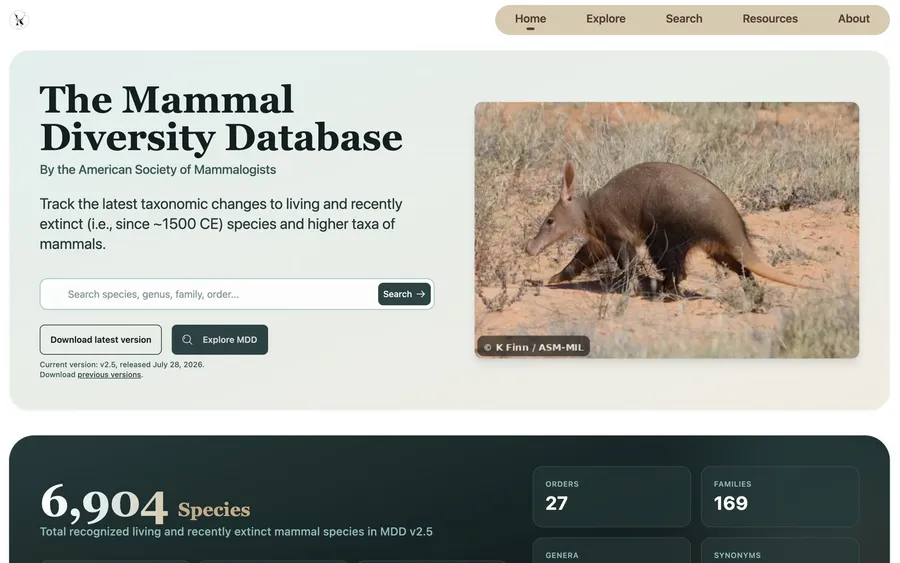
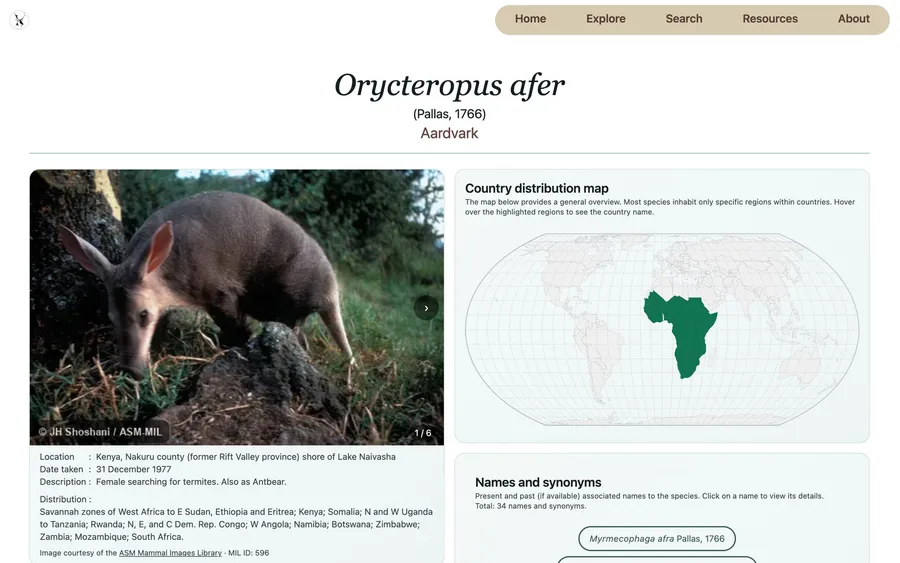
I develop the website, cross-platform app, and data tooling for the Mammal Diversity Database
of the American Society of Mammalogists, which tracks taxonomic changes to every
living and recently extinct mammal species. Version 2.5 recognizes 6,904 species,
each with names, synonyms, distribution, and images.
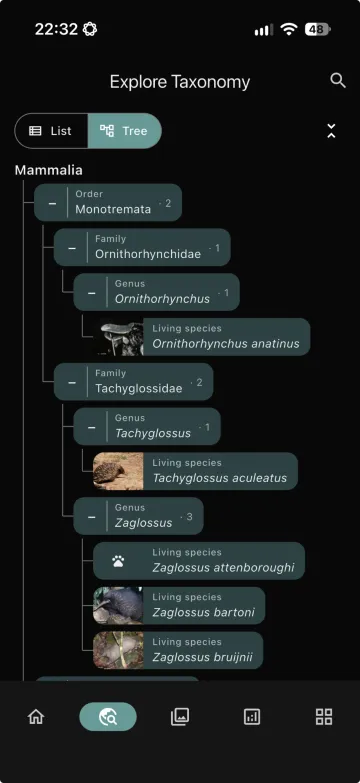
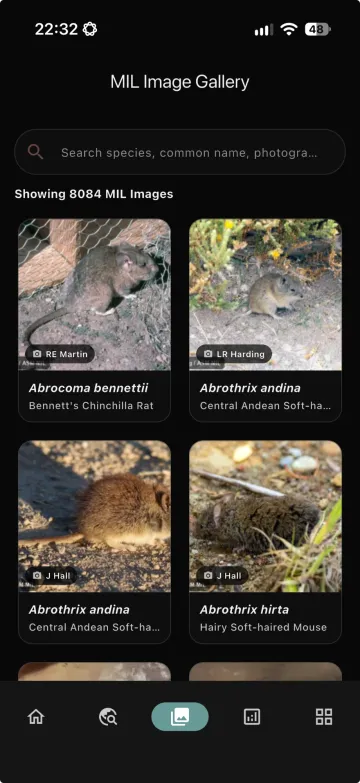
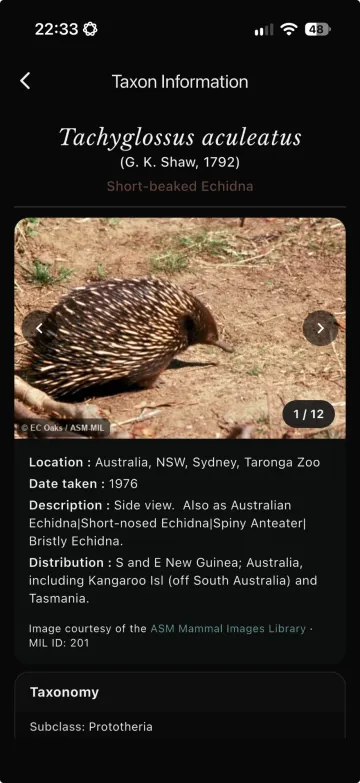
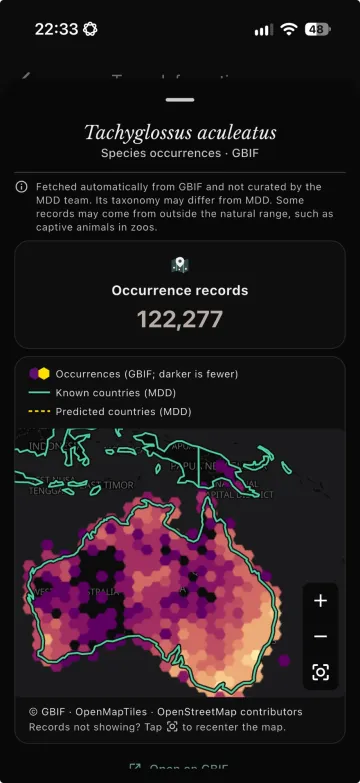
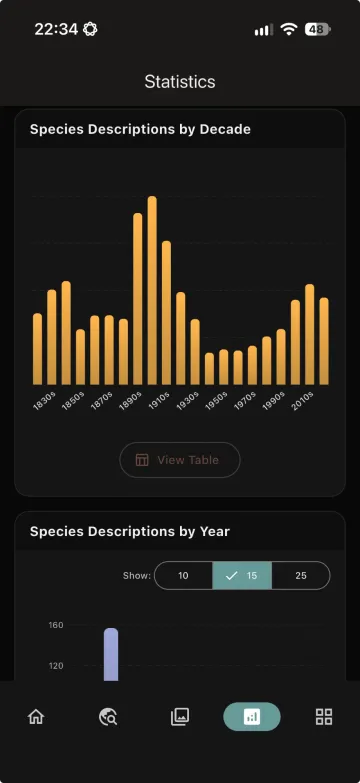
The MDD app brings the database offline, with a searchable taxonomy tree, the ASM Mammal
Images Library, GBIF occurrence maps, and description statistics.
NAHPU: An integrated approach to natural history data collection, disease surveillance, and teaching the next generation of naturalists
Handika, H., Moncrieff, A. E., Del-Rio, G., Canton, R., Delgado, F., Jaiswal, A., Gan, J. B., Henderson, C., Rutledge, S. L., Hernández-Canchola, G., Babb-Biernacki, S. J., Chipps, A. S., Pérez-Amaya, N., Chornelia, A., Morales-Martínez, D. M., McCallum, Q., Thom, G., Esselstyn, J. A. In prep
Biodiversity Inventories: Building Natural History Collections
Continuously growing collections keep natural history museums relevant:
newly acquired specimens are the best material for genomic, microbiome,
and phenomic studies, and many regions remain poorly documented. Over 13
years, my work has both drawn on existing museum collections and built new
ones, expanding sampling to under-surveyed islands and mountains.
Specimen acquisition
Targeted fieldwork in under-sampled biodiversity hotspots across the Indo-Australian Archipelago, using best practices for specimen and tissue preservation while linking photographs and recordings to voucher specimens directly in the field.
Stewardship & data
FAIR data, ready for Darwin Core and Frictionless Data from the field onward. NAHPU, our cross-platform digital field catalog, supports QR/barcode scanning and is adding automatic validation to streamline data flow from field to collection database.
Training & outreach
Collecting while training local students closest to the field sites, and explicitly crediting the communities, guides, and porters who make remote expeditions possible.
Field collecting localities
Localities from 23 field collecting expeditions in 4 countries. Larger markers show repeat visits. For all fieldwork, including biodiversity surveys, see the Fieldwork page.
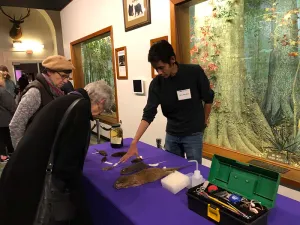
Public engagement
Museums are critical interfaces between scientific discovery and public
literacy. At outreach events, such as those at the LSU Museum of Natural
Science, I share representative specimens from our collections and the
tools we use in the field. Engagement also continues in the field, with
the local communities who make our expeditions possible.
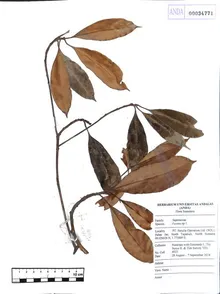
Herbarium digitization and data mobilization
This project is led by Dr. Nurainas at the Herbarium Universitas Andalas
(ANDA) funded through the collection and data mobilization grant provided
by the Global Biodiversity Information Facility (GBIF). We digitized
>65,000 sheets of the herbarium specimens at ANDA and make the data
accessible through the GBIF portal.
Published datasets:
Nurainas et. al. (
Flora of Sumatra : Vascular plant collection from Batang Toru Forest deposited in ANDA Herbarium
Nurainas N, Amolia R R, Taufiq A, Handika H, Syamsuardi S. 2024a
Genomics and Systematics of Antbirds in the Neotropics
I mentored to students: Marky Mutchler (the University of Chicago) and
Ryan Zucker (Cornell University). Both of them are under the supervision
of Dr. Glaucia Del-Rio,
the University of Florida. We aim to understand the genomic basis of
speciation and systematics of antbirds in the Neotropics. My involement is
primarily in the phylogenomic analyses of the studies.